Writing · realtime-telemetry-pipeline
Every Reading Was Valid. The Sensor Was Lying.
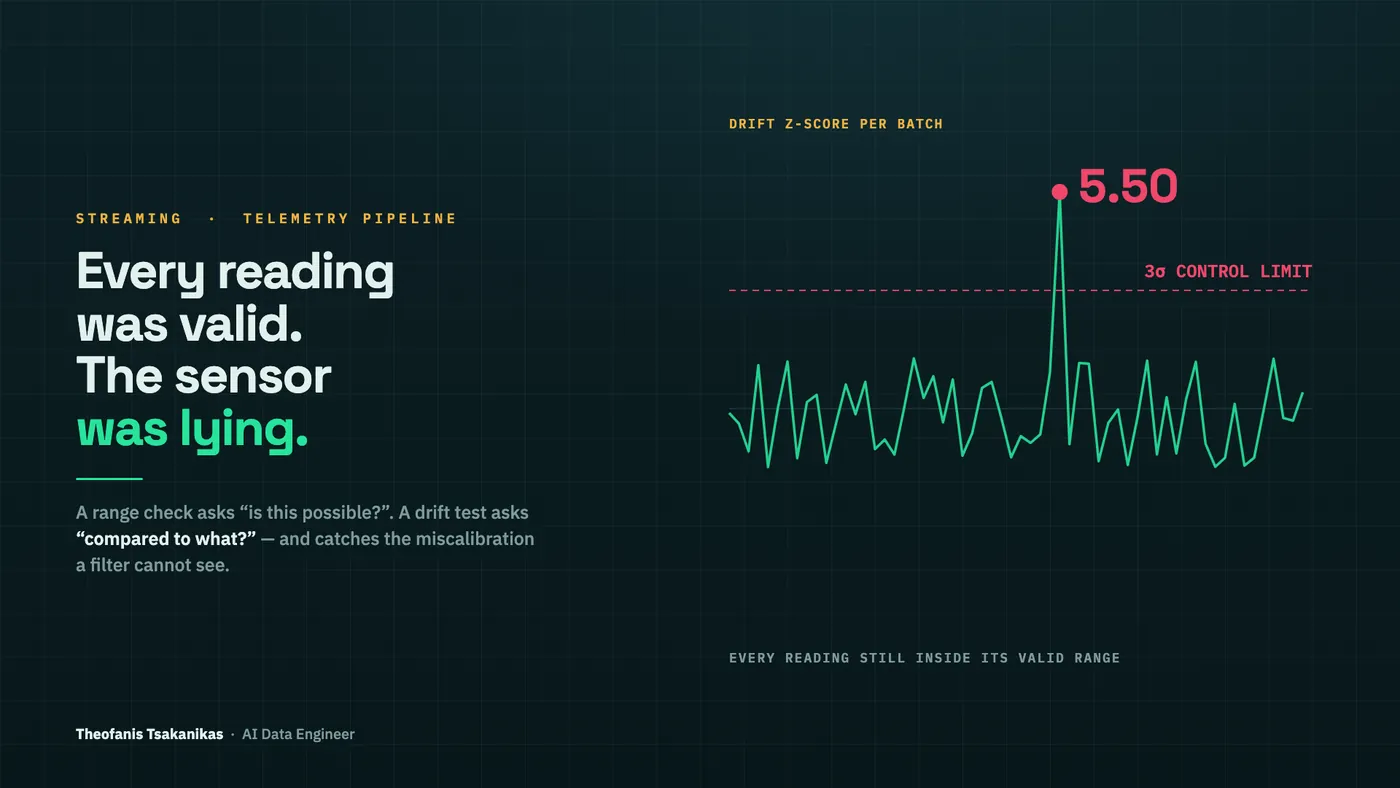
A temperature sensor starts reading five degrees high. Not wildly — five degrees.
Every single reading is still inside the valid range. Every schema check passes. Every null check passes. The dead-letter queue stays empty. The dashboard is green.
And every number downstream is wrong.
This is the failure mode that validation is structurally blind to, and it is the one this project was built around.
Why range checks can't see it
A validation contract answers one question: is this reading possible? Ten to forty-five degrees, zero to a hundred percent humidity, 950 to 1050 hPa.
A miscalibrated sensor answers that question correctly every time. It doesn't emit garbage — it emits plausible values that are systematically shifted. There is no individual reading you could point at and call wrong.
So the pipeline asks a second, different question, once per micro-batch: is this batch's mean where it should be? Each metric's batch mean is z-tested against the range the sensor read within at commissioning:
@property
def normal_mean(self) -> float:
    """Baseline mean of a uniform U(normal_min, normal_max)."""
    return (self.normal_min + self.normal_max) / 2.0

@property
def normal_std(self) -> float:
    """Baseline standard deviation of a uniform U(normal_min, normal_max): range/√12."""
    return (self.normal_max - self.normal_min) / sqrt(12.0)
Note what that code does not do: it does not let anyone hand-type a baseline. The mean and standard deviation are derived from the declared commissioning range, so the drift reference can never silently disagree with the data the system actually expects. A hard-coded baseline is a number that drifts away from reality the first time anyone changes a range and forgets the other file.
The failure a range check cannot see
Here is one caught in the act — a humidity probe rather than the thermometer, but the same failure:
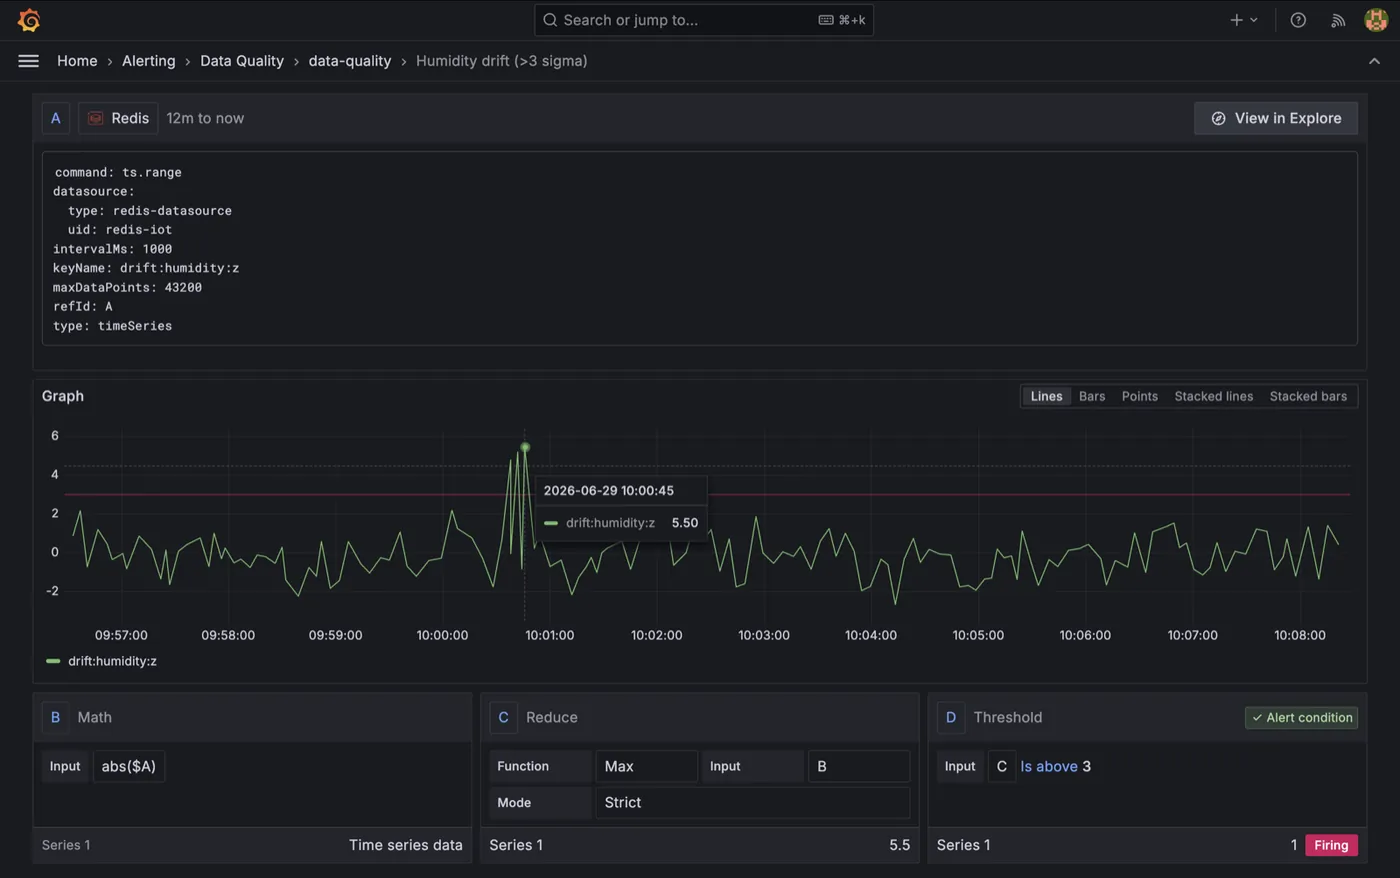
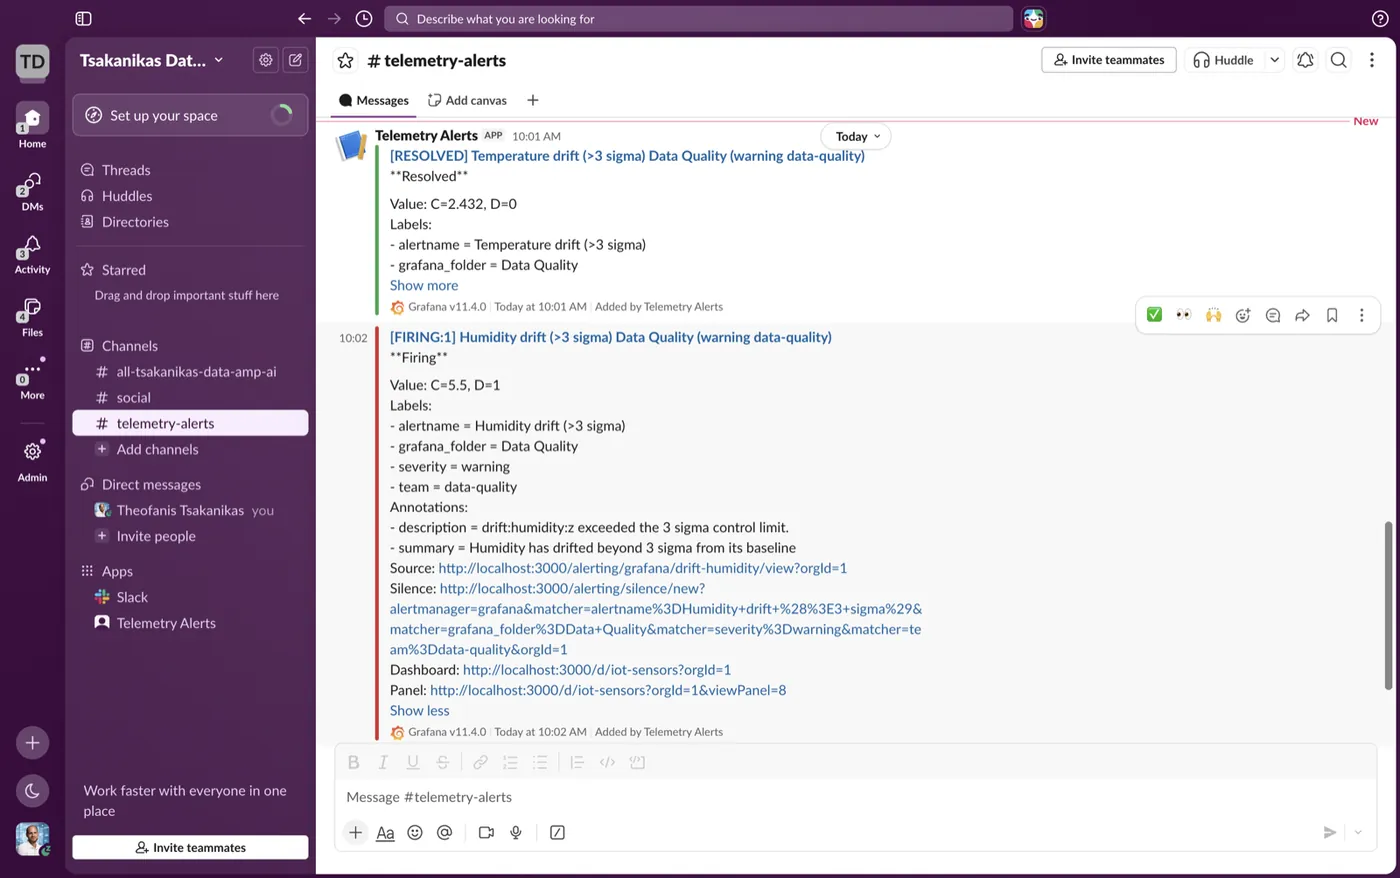
That second point matters more than it sounds. An alert rule configured by hand in a dashboard is a control that exists in exactly one environment and disappears with it. This one is a file.
One contract, five consumers
The reason the drift detector and the validator can't disagree is that neither of them owns the definition. A single declared contract does:
TEMPERATURE = MetricSpec("temperature", 10.0, 45.0, normal_min=15.0, normal_max=35.0)From that one line come five things: the acceptance filter, the dead-letter rejection reason, the data-quality metrics, the drift baseline, and a declarative Pandera schema built from the same spec — the version of the contract you can hand to a stakeholder as a document instead of explaining it as code.
That last one is deliberately kept outside the streaming hot path. It's a verification artifact, not a gate: ingestion must never be able to fail because a validation library raised. And the Streamlit companion app has a test that asserts its own display ranges still match the contract — a drift guard on the code, not the data.
This is the same pattern I used in the contract-driven pipeline that opened this series, arrived at independently for streaming: put the definition in one place, and make every consumer derive from it rather than restate it.
The contract at the wire
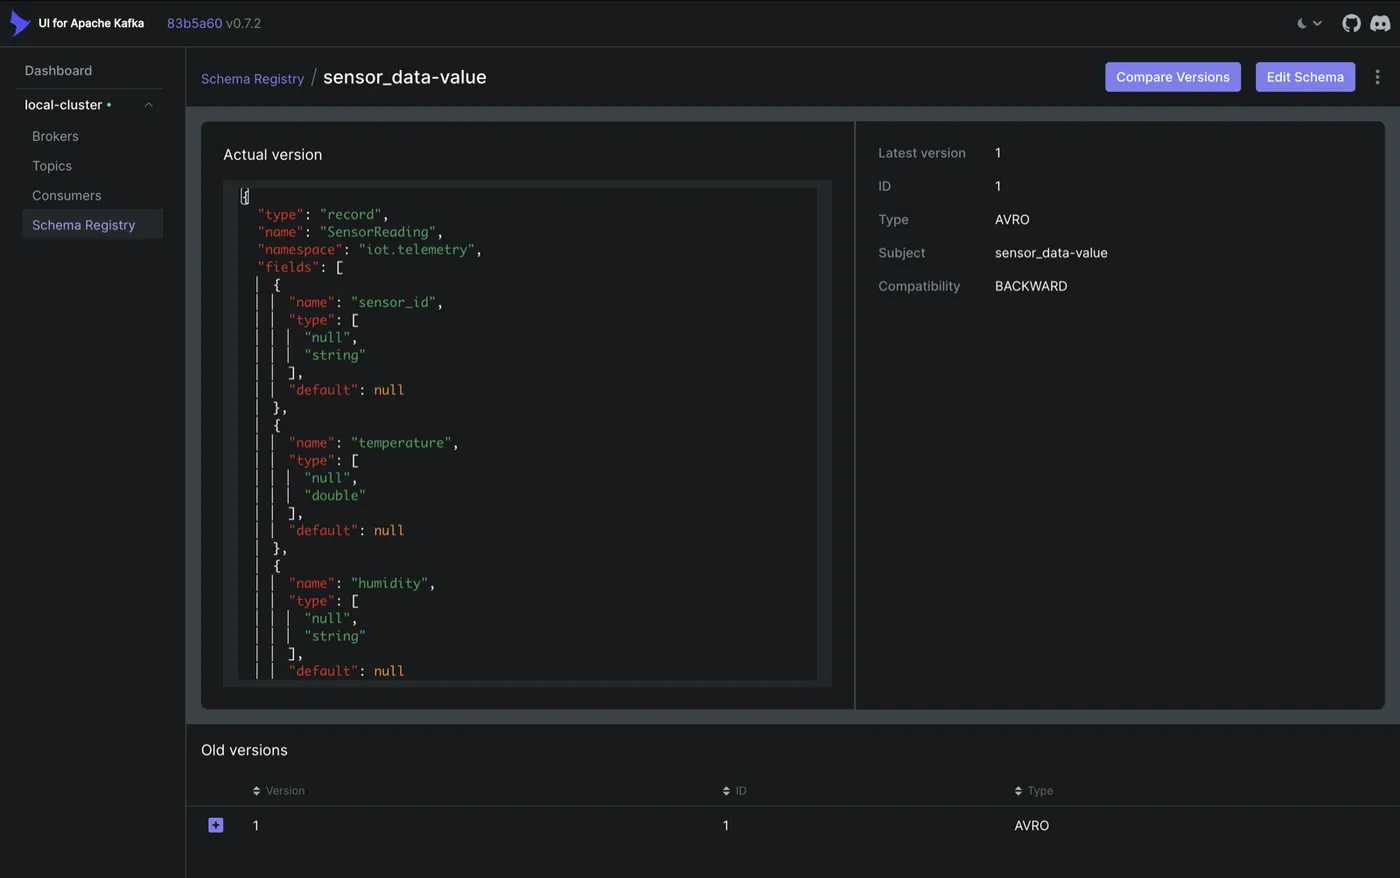
Readings travel as Avro, governed by a Schema Registry, rather than as free-form JSON. The schema is enforced at the broker boundary, so a producer that changes shape is a registration failure — not a downstream parsing mystery three services later.
Rejected, with a reason
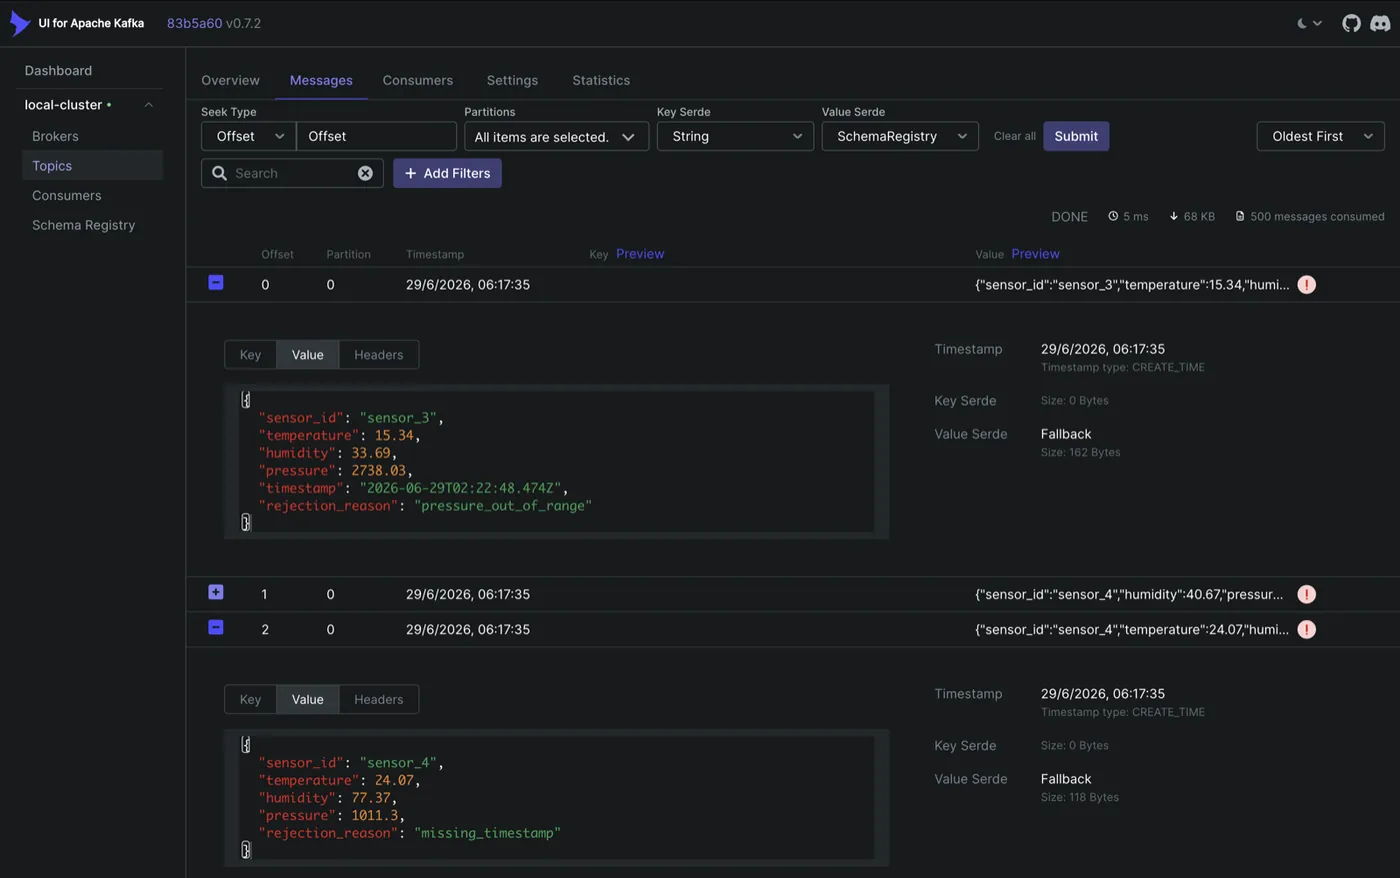
Readings that fail validation aren't dropped. They're routed to a dead-letter topic, each tagged with the first rule it violated — invalid_humidity, pressure_out_of_range, and so on.
The clean branch and the rejected branch are exact complements: together they partition the input, and there's a test that asserts precisely that. A row cannot fall between them and vanish.
About 20% of the simulated readings are deliberately anomalous — null temperatures, humidity arriving as the string "N/A", pressures of 2000–3000 hPa, missing timestamps. That's on purpose. A source that arrives clean makes the cleaning stage theatre, and you never find out whether the DLQ works.
The hot path and the cold path
The same validated stream lands in two places, from one Spark job:
- Redis TimeSeries — the hot path, for sub-second serving. The sink opens one pipelined connection per Spark partition and writes with native
TS.ADD, usingON_DUPLICATE LASTso a replayed micro-batch is idempotent rather than duplicated. - BigQuery — the cold path, for analytics.
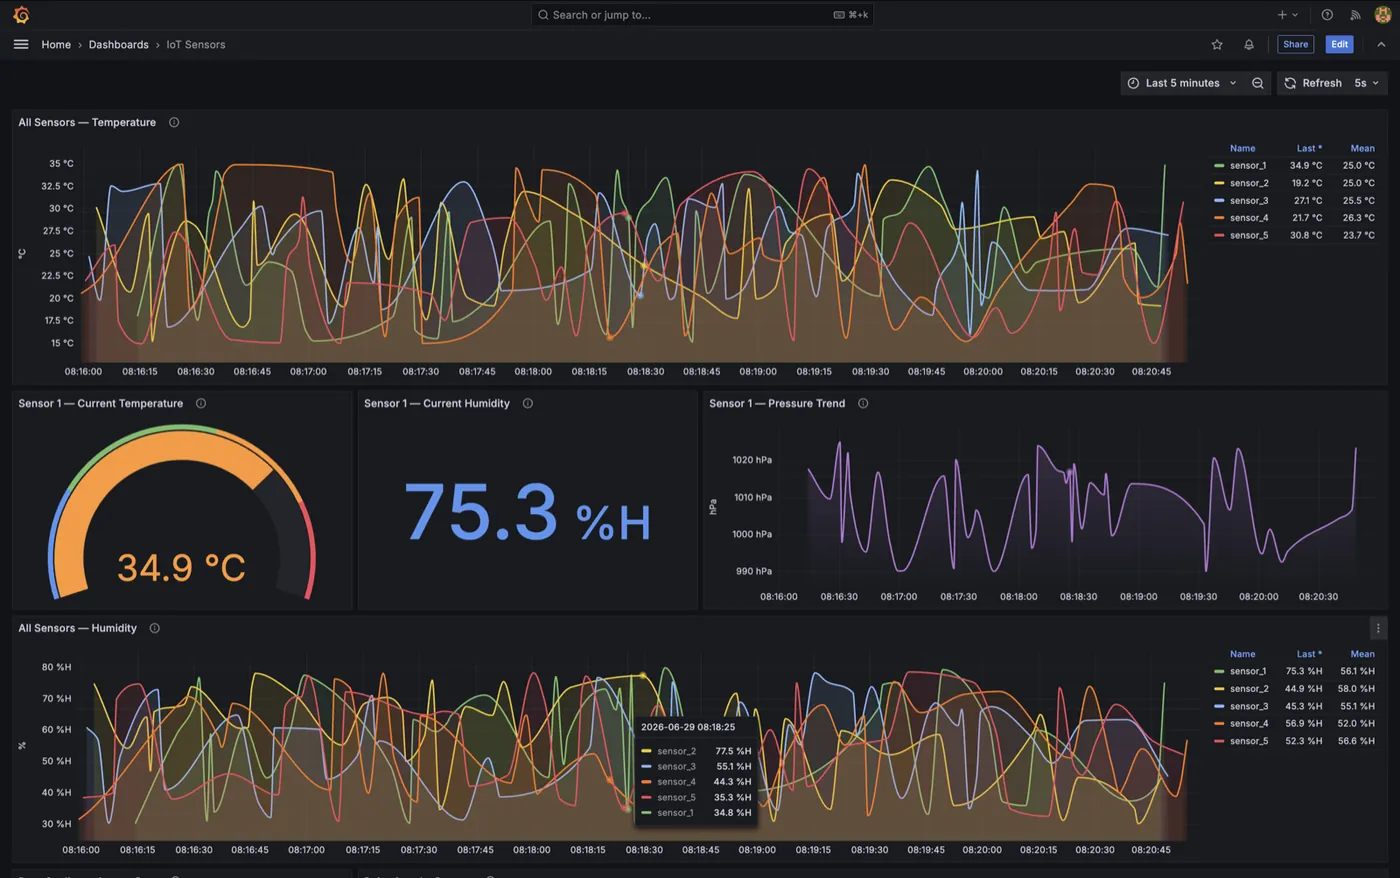
One detail in the Spark job is a small architectural statement: the BigQuery write is best-effort. Errors are logged, never raised. If the analytics warehouse is unavailable, the ingestion path keeps running and the live dashboards keep serving.
The same applies to the observability sink. Analytics and monitoring must not be able to take down ingestion — if your metrics pipeline can halt your data pipeline, you have coupled the thing that watches to the thing being watched.
Quality as a first-class output
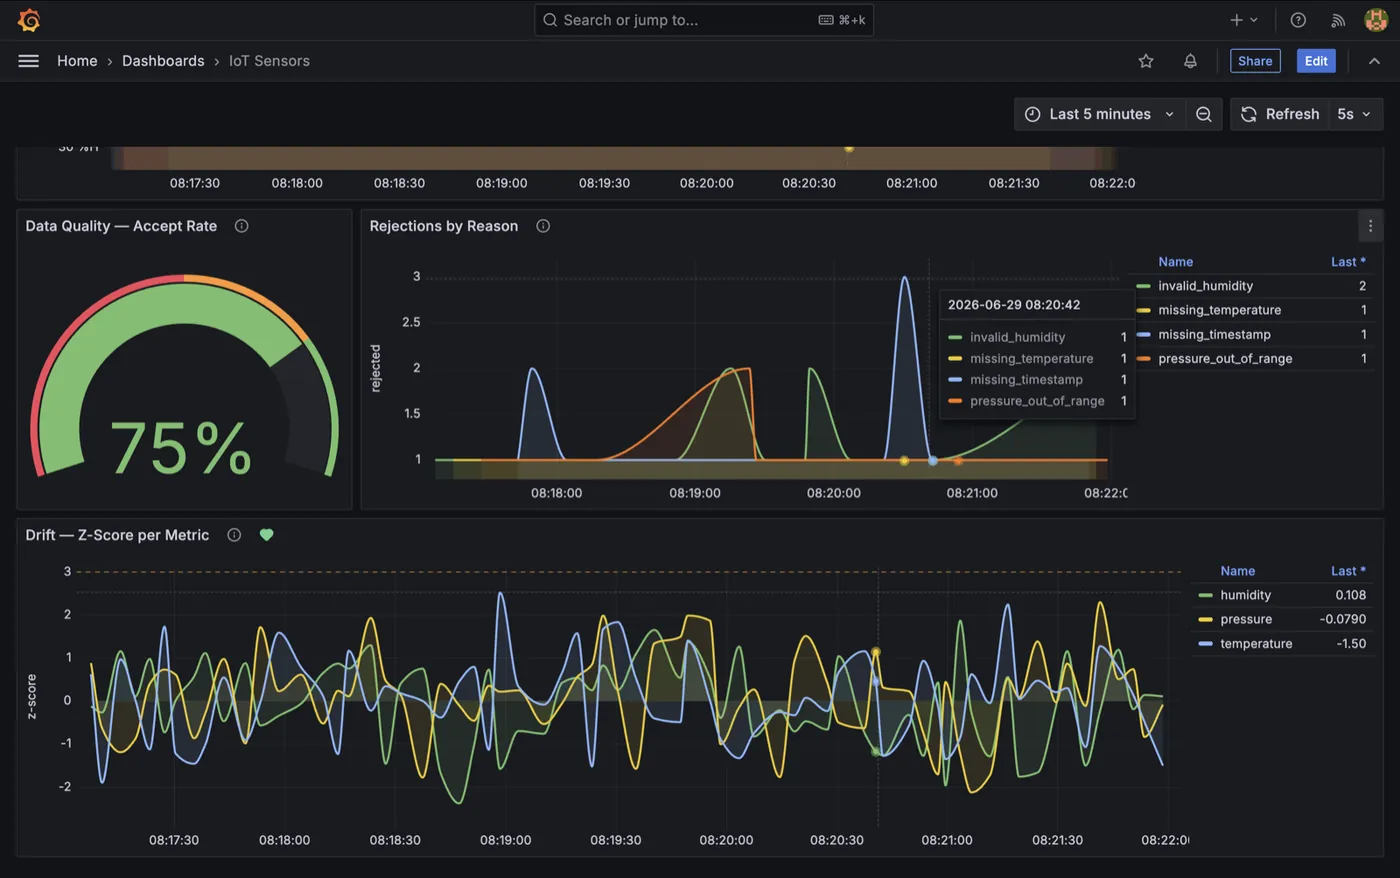
Every micro-batch publishes its accept rate, its rejection breakdown by reason, and a per-metric drift z-score — to the same Redis the sensor data goes to, rendered on a dedicated dashboard row.
So the operator looking at "how are the sensors doing?" sees, on one screen, both what the sensors said and whether the pipeline believed them. Data quality isn't a separate report that someone remembers to open quarterly.
One small thing that matters at three in the morning: those observability samples are stamped with the batch's event time, not the wall clock of whichever machine wrote them. Replay a backlog and the drift chart lines up with when the readings actually happened, rather than with when Spark got round to them.
That is the business-level signal. Underneath it sits a second, separate layer: the Spark driver exposes Prometheus metrics, and in the cloud GKE Managed Service for Prometheus scrapes them into Cloud Monitoring — streaming throughput, micro-batch latency, JVM heap and GC. Locally, a self-hosted Prometheus backs the same Pipeline Health dashboard. Is the data right? and is the machine moving it healthy? are not the same question, and a system that answers only one of them will eventually surprise you.
The cold path, modelled
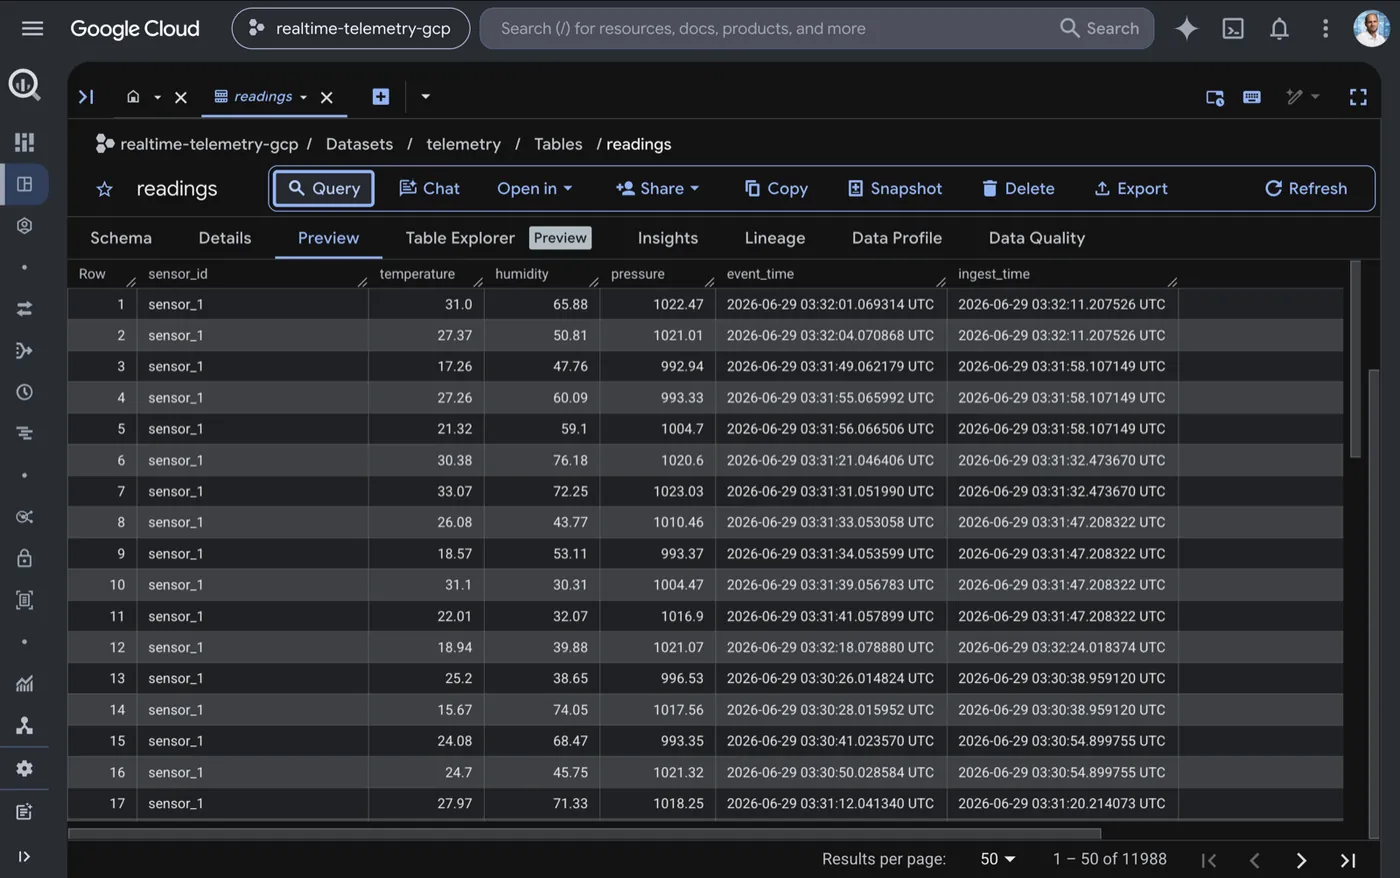
The streaming job lands two raw tables in BigQuery — readings and rejections — day-partitioned with a 30-day expiry so the cost has a ceiling by construction rather than by discipline.
dbt turns them into typed staging views and four tested marts: per-sensor-per-minute aggregates, accept rate over time, rejections by reason, and reading volume. A Kubernetes CronJob runs dbt build every two minutes, so the marts track the live stream closely enough to be useful for actual analysis rather than yesterday's summary.
Keyless, and ephemeral on purpose
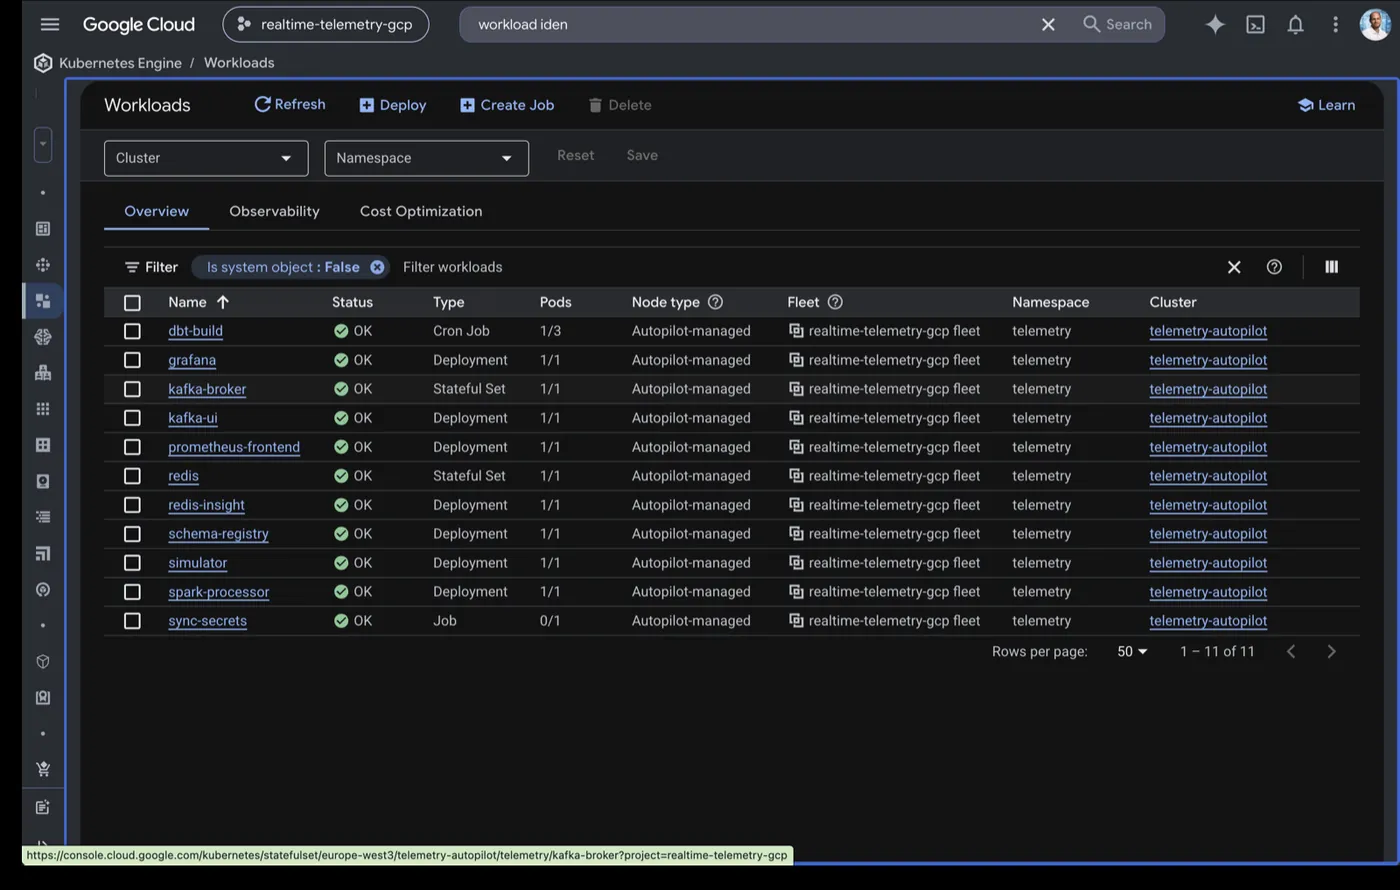
The whole stack runs on GKE Autopilot, provisioned entirely in Terraform and deployed from a GitHub Actions button. There are no service-account keys anywhere in the system:
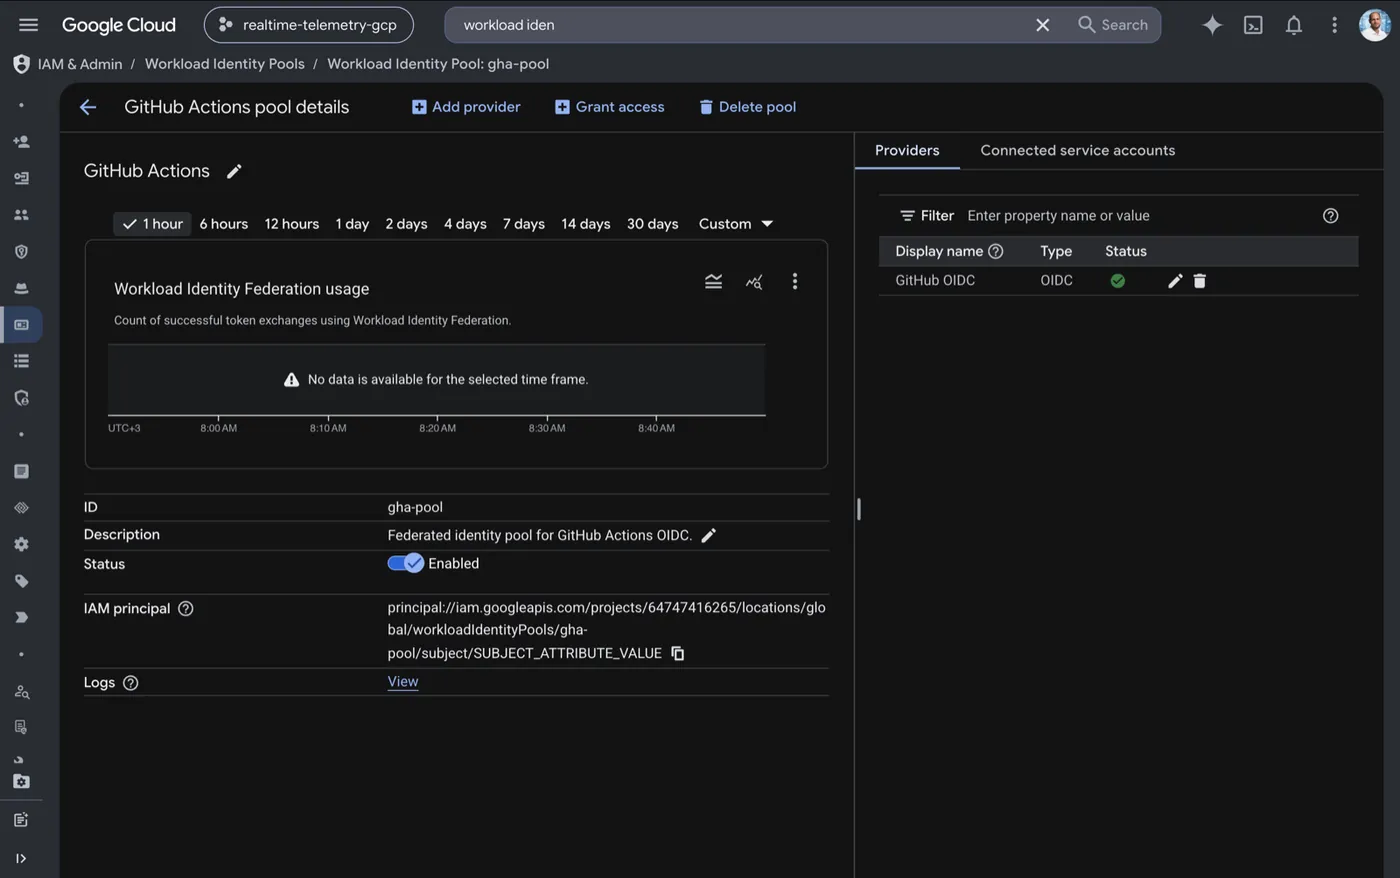
- GitHub Actions authenticates to Google Cloud via Workload Identity Federation, locked to this repository.
- Pods authenticate to BigQuery and Secret Manager via Workload Identity — no key files mounted into containers.
kubectlreaches a private control plane through Connect Gateway — no bastion host, no public endpoint.- Secrets are pulled from Secret Manager through the GKE-managed Secrets Store CSI driver and materialised only when the first pod mounts them — so no credential is ever written into a manifest.
Terraform is split into two layers with deliberately different lifecycles. The foundation layer — identity, secrets, registry, BigQuery — is applied once and persists, costing cents when idle. The app layer — VPC, NAT, the Autopilot cluster — is ephemeral and destroyed with one action.
That split is a cost-control decision expressed as architecture: the expensive things are the ones designed to be torn down, and tearing them down doesn't destroy the data or the identity configuration you'd have to rebuild by hand.
What this is worth to a business
Your dashboards go green before your data goes wrong. The dangerous data-quality failure isn't the one that breaks a pipeline — that one pages someone. It's the one that flows perfectly through every check and quietly biases every decision downstream. Validation catches malformed data. It cannot catch plausible data that is wrong.
"Compared to what?" is the question most quality tooling never asks. A range check compares a reading to a constant. A drift check compares a distribution to how the thing behaved when it was known-good. Only the second one can notice that something changed.
A rejected record is evidence, not waste. Rejections tagged by reason, trending over time, tell you which upstream source is degrading and how fast — the difference between "data quality is 94%" and "sensor 3's humidity has been failing for six hours."
Keyless authentication removes an entire class of incident. There are no long-lived credentials to leak, rotate, or find in a repository, because none exist.
What I'd tell you before you looked
The sensors are simulated. Real device telemetry over an MQTT bridge would use the same contract, the same cleaning and the same observability, but I'm not going to describe a simulator as a fleet.
Single Kafka broker, replication factor 1, one Spark driver. That's a portfolio deployment, not a resilient one, and the README says which specific things change for production — three brokers, min.insync.replicas=2, multiple executors. The transformation, contract, drift and IaC logic are production-shaped already; what changes is scale and redundancy of the infrastructure, not the pipeline code.
The suite is 102 tests, of which 99 run anywhere — a local SparkSession and a mocked Redis client, no Kafka, no Redis, no Docker, no cloud. The other three are marked integration and deselected by default, because those genuinely want a Docker daemon. And the tests aren't the only gate: CI runs four on every push — lint and unit tests, the Compose file resolving, the dbt models compiling, and the Kubernetes manifests building under kubeconform. A broken manifest fails the pull request rather than the deploy.
The takeaway
Every project in my portfolio keeps circling the same idea from a different direction: a system should be able to tell you when it is wrong.
A contract that generates its own documentation. A guardrail suite attacked eighty times to prove it can fail. A privacy boundary in the query engine instead of in a policy document. An agent that refuses a diagnosis it cannot quote evidence for. A pull request that goes red before PII is exposed. And here, a statistical test that catches the sensor lying inside its own valid range.
None of those are about moving data faster. They're about the far harder problem: knowing whether to believe it.
Full repo — the streaming stack, the drift detector, the Terraform layers and the keyless deploy: https://github.com/theofanis-tsakanikas/realtime-telemetry-pipeline
If you run sensors, or any source you don't control: how would you find out today that one of them started reading five percent high? I'd genuinely like to know what's working for people.
One of a series of write-ups on the projects in my portfolio — each one a reference implementation of the trust layer that makes data and AI safe to ship.
The code, the CI and every test behind this article are public.